
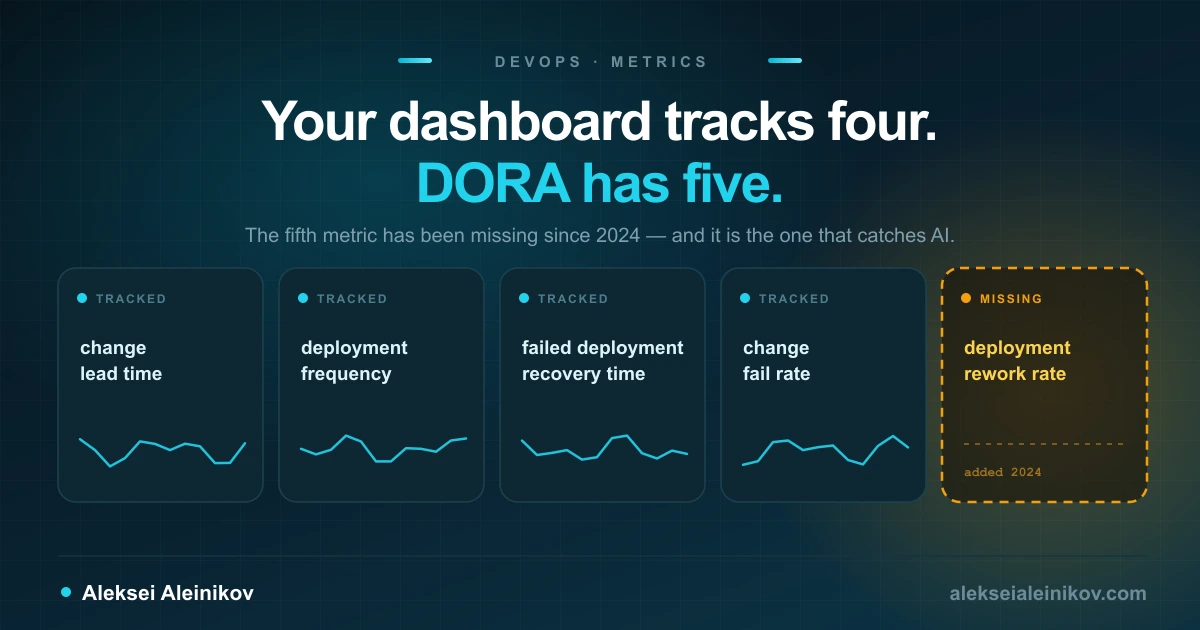
Open any engineering dashboard that claims to track DORA and you will almost certainly see four tiles: deployment frequency, lead time, change failure rate, and MTTR.
Three of those four labels are out of date, and the set itself is incomplete. DORA moved to five software delivery metrics in its 2024 research, renamed one of them back in 2023, and moved another into a category most teams still get wrong. In its 2025 year in review, DORA stated it plainly: “We have also officially evolved the four software delivery performance metrics into five metrics.”
This is not pedantry about naming. The changes encode findings that directly affect how you should read your own numbers — and one of them exists specifically because teams were measuring the wrong kind of failure.
The Five Metrics, As They Stand Now
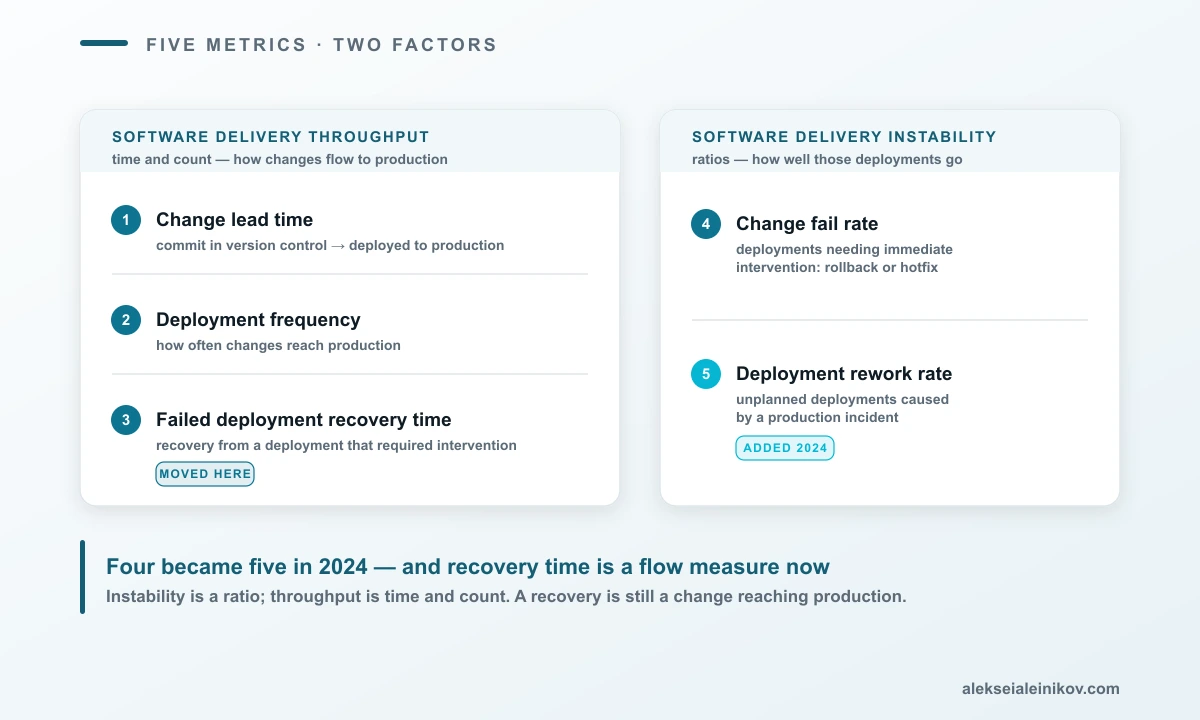
DORA groups the five metrics into two factors: throughput and instability.
Throughput — how changes move through the system
| Metric | What it measures |
|---|---|
| Change lead time | Time from a change being committed to version control until it is deployed to production |
| Deployment frequency | How often application changes are deployed, or the time between deployments |
| Failed deployment recovery time | How long it takes to recover from a deployment that failed and required immediate intervention |
Instability — how well those deployments go
| Metric | What it measures |
|---|---|
| Change fail rate | The ratio of deployments that require immediate intervention — a rollback or a hotfix |
| Deployment rework rate | The ratio of deployments that are unplanned, happening as a result of a production incident |
Two things in that table surprise people who learned the four keys years ago.
Recovery time is under throughput. For a decade it lived on the stability side, as the counterweight to speed. It is now grouped with the flow measures. The logic holds up once you look at the shape of the numbers: instability is expressed as ratios — what proportion of your deployments go badly — while throughput covers the time and count measures of changes moving to production. Recovering from a failed deployment is itself a change being pushed to production, just under maximum pressure.
There is a metric most teams have never recorded. Deployment rework rate is the newcomer, and its origin story is the most interesting part of the 2024 research.
Why a Fifth Metric Was Needed
DORA’s researchers noticed that change fail rate was quietly doing two jobs. It was meant to capture how often deployments go wrong, but teams were also treating it as a proxy for how much rework the team ends up doing.
Those are not the same thing, and conflating them hides a real failure mode. A team can have a respectable change fail rate while a large share of its deployment volume is unplanned work generated by incidents. On a four-metric dashboard that team looks fine. In reality a growing fraction of its capacity is being consumed by fixing production rather than delivering anything new.
Deployment rework rate separates the two. Change fail rate asks did this deployment break something? Rework rate asks was this deployment only necessary because something was already broken?
If you have ever watched a team’s deployment frequency climb while nobody could name a single new feature that shipped, you have seen the gap that this metric fills.
The Renaming That Fixed a Real Measurement Bug
Before the count changed, the definitions did. In 2023, DORA renamed the metric long known as MTTR or time to restore service to failed deployment recovery time.
The reasoning was precise. The old definitions did not distinguish between:
- a failure caused by a change you deployed, and
- a failure caused by something else entirely — a cloud region going down, a provider outage, a data centre problem.
Those belong to different systems. The first is a property of your delivery process; the second is a property of your infrastructure and your luck. Averaging them together produced a number that moved for reasons unrelated to how the team worked, which is exactly what you do not want from a delivery metric. Narrowing the definition to impairments caused by a change to production aligned it statistically with the other delivery metrics.
The practical consequence: if your dashboard’s “MTTR” tile is fed by every incident in your incident tracker, it is not the DORA metric. It is a mix of two different signals, and you cannot act on it cleanly.
The Myth of “Reliability, the Fifth Metric”
You will still find articles, decks, and vendor pages calling reliability the fifth DORA metric. That framing came from DORA’s own 2021 report — and DORA has since corrected it.
The history of the metrics states that the 2021 report “inaccurately called the ‘reliability’ metric the ‘fifth metric’ when, in reality, ‘reliability’ is more a measure of operational performance than a measure of software delivery performance.”
The distinction matters. Reliability, measured through service level objectives, is about how well the software behaves for users once it is running. Software delivery performance is about how well changes get to production. Both belong in the DORA Core model, but they are different constructs and they answer to different work.
Note also what this means for anyone auditing their own documentation: the four-versus-five confusion is not just an industry lag. Even DORA’s Core model, which is deliberately conservative and — in DORA’s words — “deliberately trails the research”, still presents the older four-key grouping. The guides and the current research are ahead of it. That is by design, but it is a good reason to check the date on whatever you are reading.
Measuring Them Without Buying a Platform
You do not need a vendor to get started. Four of the five come out of deployment events; the fifth needs a small amount of human input that no API can infer for you.
Start from deployments, not pull requests. This is the single most common instrumentation mistake, and it makes lead time look far better than it is.
# Change lead time from GitHub deployment events.# Key detail: measure from the FIRST commit in the change, not from PR merge.import statisticsfrom datetime import datetime, timezone
def lead_time_seconds(deployment_finished_at, commit_authored_at):    return (deployment_finished_at - commit_authored_at).total_seconds()
def summarise(samples):    """Report the median. Delivery distributions have long tails that a mean will hide."""    if not samples:        return None    return {        "p50": statistics.median(samples),        "p90": statistics.quantiles(samples, n=10)[8] if len(samples) > 1 else samples[0],        "n": len(samples),    }
Why the first commit and not the merge? Because the review queue is part of your lead time. A team with a two-hour pipeline and a four-day review backlog does not have a two-hour lead time — and measuring from merge is precisely how that four-day backlog stays invisible to everyone above the team.
For the remaining metrics, the definitions translate into simple ratios over a window:
deployment_frequency = successful_production_deployments / windowchange_fail_rate = deployments_needing_immediate_intervention / total_deploymentsdeployment_rework_rate = unplanned_deployments_caused_by_incident / total_deploymentsThe input your Git host cannot give you is which deployments needed immediate intervention and which were unplanned incident work. That has to come from somewhere your team already records reality — an incident tracker, a rollback label, a deployment annotation. A pragmatic starting point is a single required field on every production deployment: planned, hotfix, or rollback. Three values, filled in at deploy time, are enough to compute both instability metrics.
DORA is explicit that this is where teams over-invest. Building integrations across every system to get precise numbers “might not be worth the initial investment” — starting with conversations, or with the DORA Quick Check, often produces improvement faster than a perfect pipeline of telemetry does.
If you want the fastest possible confirmation that the fifth metric is real rather than a documentation change: DORA updated the Quick Check in April 2026 to include deployment rework rate, along with refreshed industry benchmarks. The tool asks you for it now.
Where These Numbers Break
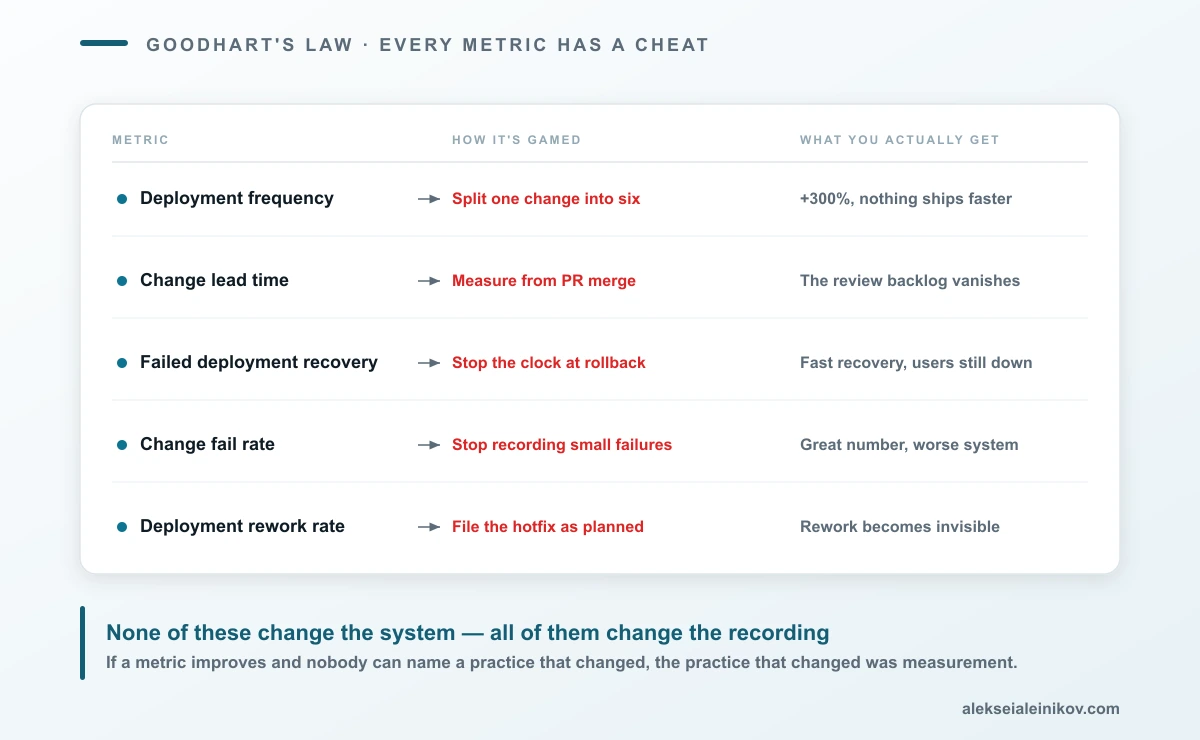
Every DORA metric has a trivial gaming strategy. This is not a flaw in the metrics; it is what happens to any measure that becomes a target. DORA lists “setting metrics as a goal” as its first common pitfall and cites Goodhart’s law by name.
| Metric | How it gets gamed | What you actually see |
|---|---|---|
| Deployment frequency | Split one change into six deployments | The number triples, nothing ships faster |
| Change lead time | Measure from PR merge instead of first commit | The review backlog disappears from the data |
| Failed deployment recovery time | Declare recovery when the rollback finishes, not when users are served | Fast recovery, unhappy users |
| Change fail rate | Stop recording small failures as failures | A world-class number and a worsening system |
| Deployment rework rate | File the hotfix as planned work | Rework becomes invisible |
Notice the pattern: none of these change the system, all of them change the recording. That is the tell. If a metric improves and nobody can point to a practice that changed, the recording changed.
The other pitfalls DORA calls out are worth knowing because they show up in almost every rollout:
- One metric to rule them all. Complex systems need several measures held in tension. A single number always gets optimised at the expense of something unmeasured.
- Disparate comparisons. These metrics apply to one application or service. Comparing a mobile app to a mainframe system, or blending numbers across an entire org, produces something that looks like a leaderboard and means nothing.
- Siloed ownership. If only the ops team owns stability and only dev owns throughput, you have built a finger-pointing machine. The five are meant to be shared.
- Competing. The goal is to improve against your own past, not to beat another team.
- Industry as a shield. “We’re regulated, so we can’t deploy more often” is usually a claim about a process nobody has revisited, not about the regulation.
The deepest version of this problem is using DORA metrics on individuals. The metrics are validated as team-level predictors of organisational performance and employee well-being. Applied to a person, they measure that person’s position in a queue.
The 2026 version of this mistake: tokenmaxxing
The newest example is not a DORA metric at all, which is what makes it useful.
In June 2026 DORA published on a trend it calls tokenmaxxing: organisations tracking and rewarding raw AI token consumption through internal leaderboards to spur adoption. DORA’s read is balanced — the gamification can genuinely nudge AI-hesitant developers into experimenting — but its conclusion is blunt: treating token spend as a performance indicator is a dangerous trap.
It is the same failure as putting deployment frequency in a performance review, one abstraction layer up. Token spend measures activity. It is trivially maximised by generating more, verifying less, and pasting bigger contexts. If your organisation has learned not to reward raw commit counts, it already knows why this one ends badly.
What AI Changed
DORA renamed its annual report in 2025 from Accelerate State of DevOps to State of AI-assisted Software Development, and the finding that headlines that research is a useful corrective to both the hype and the backlash.
AI is framed as an amplifier: it magnifies an organisation’s existing strengths and weaknesses. Concretely, DORA found that AI improves throughput but often at the cost of stability when the underlying foundation is not solid. The report’s own framing is that the greatest returns on AI investment come “not from the tools themselves, but from a strategic focus on the underlying organizational system.”
Read that against the five-metric model and the design suddenly looks prescient. If AI raises throughput while weak foundations turn that speed into defects, then the metrics that catch the damage are exactly the two instability ratios — and one of those, deployment rework rate, did not exist on your dashboard two years ago. A team shipping faster with AI and tracking only four metrics has instrumented the half of the picture that is guaranteed to look good.
DORA’s companion AI Capabilities Model, published at the end of 2025, names seven capabilities that amplify AI’s benefits, including strong version control practices, working in small batches, a quality internal platform, AI-accessible internal data, and a clear and communicated AI stance. Three of those are ordinary delivery hygiene that predates AI by a decade. That is the point.
DORA’s 2026 follow-up work sharpens the warning. Its March 2026 analysis of AI tensions describes the hidden taxes that arrive with faster code generation: verification overhead, skill degradation, and integration friction. The current ROI of AI-assisted Software Development report is built around the same reality, giving leaders a framework for the initial “productivity dip” of a rollout. None of that shows up in throughput. All of it shows up in rework.
A Practical Checklist
If you want to modernise your DORA setup, in rough order of payoff:
- Count your tiles. If there are four, you are missing deployment rework rate.
- Check what feeds your recovery metric. If it includes incidents not caused by a deployment, it is not failed deployment recovery time.
- Move lead time’s start to the first commit. If it starts at merge, you are hiding your review queue.
- Add three values to your deploy record:
planned,hotfix,rollback. Both instability metrics fall out of that. - Report medians, and report n. A p50 with no sample size is a rumour.
- Scope to one service. Blended org-wide numbers are for slides, not for decisions.
- Remove them from performance reviews. If they are attached to individual outcomes, everything above is wasted.
- Pair every metric with a conversation. DORA’s own guidance is that the improvement comes from the discussion about constraints, not from the dashboard.
The Part Worth Keeping
Strip away the version changes and DORA’s central finding from 2015 still stands, and it is still the reason these metrics matter: speed and stability are not a trade-off. Teams that do well do well across all five. Teams that do badly do badly across all five. The metrics correlate.
Dave Farley’s formulation, quoted in DORA’s own guide, is the one to remember: “the real trade-off, over long periods of time, is between better software faster and worse software slower.”
The five metrics are a compass for that, and nothing more. They will tell you where your delivery system is constrained. They will not tell you who to promote, which team is best, or whether your AI rollout was worth it — and every failure mode in this article comes from asking them a question they were never designed to answer.
Related reading: if you are building the delivery system these metrics measure, start with platform engineering on Kubernetes and GitOps with Argo CD. For the pipeline itself, see the secure GitLab CI/CD hardening playbook.
Sources: all facts in this article come from DORA’s own publications — the software delivery performance metrics guide, the history of DORA’s metrics, the 2025 year in review, and the 2025 report overview.
From the community
Discussion on the Fediverse
Replies from Mastodon and Bluesky — straight from the open web, no tracking.
Loading replies …
No replies yet. Start the conversation:
Replies could not be loaded right now.