
You get paged at 3 a.m.: checkout latency has doubled. The dashboard shows the spike, the logs from twelve services show nothing obviously wrong, and nobody can tell which of the forty calls behind one checkout request is slow. That gap — between something is wrong and this is what is wrong — is what observability is for, and OpenTelemetry is how most teams now fill it.
It is also one of the most misunderstood projects in the cloud-native world. People install it expecting a monitoring product and find a specification, a dozen SDKs and a Collector with hundreds of components. This guide explains how the pieces fit, how data actually moves from your code to a backend, how to deploy it on Kubernetes without drowning in config, and which decisions make it cheap or expensive in production. Every config and code sample here was run against OpenTelemetry Collector Contrib v0.162.0.
What Is OpenTelemetry?
OpenTelemetry (often shortened to OTel) is an open-source observability framework for generating, collecting and exporting telemetry — traces, metrics and logs. It is vendor-neutral: the same instrumentation can send data to Jaeger, Prometheus, Grafana, Google Cloud, Datadog or any other backend that understands its protocol.
Just as important is what it is not. In the project’s own words, OpenTelemetry is not an observability backend: storage and visualisation are deliberately left to other tools. If you are looking for dashboards, you are looking at the wrong layer.
The project is built on two promises: you own the data you generate — no vendor lock-in — and you learn one set of APIs and conventions instead of one per vendor. It was formed in 2019 from the merger of OpenTracing and OpenCensus, two older projects that tried to solve the same problem separately. It joined the CNCF in May 2019, moved to Incubating in August 2021 and reached Graduated status on 11 May 2026, the same maturity level as Kubernetes and Prometheus.
OpenTelemetry consists of:
- A specification for every component and a protocol, OTLP, for moving data.
- Semantic conventions — standard names such as
http.request.methodork8s.pod.name, so every library describes the same thing the same way. - APIs and SDKs for C++, .NET, Erlang, Go, Java, JavaScript, PHP, Python, Ruby, Rust, Swift and Kotlin.
- Instrumentation libraries and zero-code instrumentation that produce telemetry from popular frameworks without changing your code.
- The Collector, a proxy that receives, processes and exports telemetry.
- The Kubernetes Operator and Helm charts to run all of the above in a cluster.
Monitoring vs Observability
The two words are often used interchangeably, but they answer different questions.
Monitoring tells you whether something is wrong. You decide in advance what to watch — CPU, error rate, queue depth — and alert when a number crosses a threshold. It works well for failures you can predict.
Observability lets you find out why something is wrong, including failures nobody predicted. The OpenTelemetry definition is short: observability is the ability to understand the internal state of a system by examining its outputs. In software those outputs are telemetry, and the system has to be instrumented to emit it.
| Monitoring | Observability | |
|---|---|---|
| Question | Is the system healthy? | Why is it behaving like this? |
| Known in advance | The failure modes | Only the outputs to collect |
| Typical data | Dashboards and threshold alerts on metrics | Traces, metrics and logs you can slice by any attribute |
| Good at | Predictable failures: disk full, pod crash-looping | New failures: one tenant slow on one endpoint after one deploy |
You need both. Monitoring wakes you up; observability tells you where to look. OpenTelemetry is about the second part — getting rich, correlated data out of the system in a standard shape.
Traces, Metrics and Logs: The Three Signals
OpenTelemetry calls each kind of telemetry a signal. Three are stable today; a fourth, profiles, is still in development.
Traces and spans
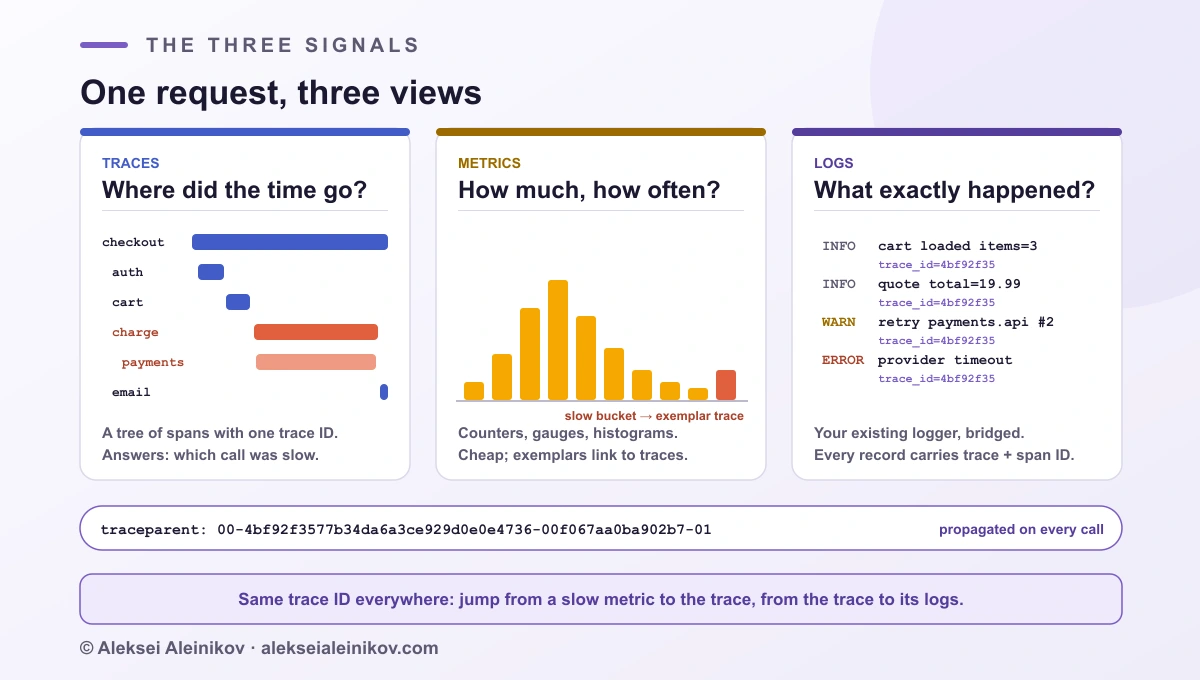
A trace is the path of one request through your system. It is made of spans: one span per unit of work — an HTTP handler, a database query, a call to a payment provider. Each span has a name, a start and end time, a span kind (server, client, producer, consumer or internal), attributes, optional events, and a status.
Spans form a tree. The first span is the root span; every other span points to its parent through a parent span ID, and all of them share one trace ID. That is how a tracing backend draws the waterfall that shows the 40 calls behind one checkout — and which one took 1.8 seconds.
Context propagation
A trace only works across services if the trace ID travels with the request. That job is called context propagation. OpenTelemetry uses the W3C Trace Context standard by default: every outgoing HTTP request carries a traceparent header.
traceparent: 00-4bf92f3577b34da6a3ce929d0e0e4736-00f067aa0ba902b7-01The four fields are the version (00), the 32-hex-character trace ID, the 16-hex-character parent span ID, and trace flags (01 means sampled). A second header, baggage, carries key-value pairs you want every downstream service to see, such as a tenant ID. The SDKs inject and extract both headers automatically for supported HTTP and gRPC libraries.
Metrics
Metrics are numbers aggregated over time: request counts, latency distributions, queue lengths. OpenTelemetry offers counters (only go up), up-down counters, histograms (distributions such as request duration) and gauges (current value), each in a synchronous form you call from code and an asynchronous form the SDK polls for you.
Metrics are cheap to store because they are aggregated — one histogram can summarise millions of requests. Their weakness is cardinality, which gets its own section below. Exemplars connect the two worlds: a latency histogram can carry the trace ID of a sample request, so you can jump from a slow bucket straight to a real trace.
Logs
OpenTelemetry does not ask you to rewrite logging. Instead, a logs bridge connects existing libraries — logging in Python, Log4j or Logback in Java, and so on — to the SDK. Each record is exported as an OTLP log with the trace ID and span ID of the active span, so you can open a trace and see exactly the log lines that were written during it.
The Collector can also read logs that never went through an SDK, such as container log files on a node, and parse them into the same format.
How OpenTelemetry Works: API, SDK, OTLP and the Collector
The architecture has four layers, and confusing them is the most common source of frustration.
- The API is what your code and libraries call: get a tracer, start a span, record a metric. On its own it does nothing — calls are no-ops until an SDK is installed. That is deliberate: a library can be instrumented with the API without forcing every user to pay for telemetry.
- The SDK implements the API. It samples spans, aggregates metrics, adds resource attributes that describe the process (
service.name,service.version,k8s.pod.name), batches the data and hands it to an exporter. - OTLP is the protocol the exporter speaks.
- The Collector is an optional but almost universal hop between your applications and your backends.
OTLP, the wire protocol
OTLP carries all three stable signals over two transports:
| OTLP/gRPC | OTLP/HTTP | |
|---|---|---|
| Default port | 4317 | 4318 |
| Encoding | Protobuf | Binary protobuf or JSON |
| Paths | gRPC services | /v1/traces, /v1/metrics, /v1/logs |
| Good for | Service-to-Collector, Collector-to-Collector | Browsers, proxies, firewalls that only allow HTTP |
The protocol defines how to behave under failure, which matters when telemetry spikes during an incident. Over HTTP, 429, 502, 503 and 504 are retryable and a Retry-After header must be honoured; a 400 means the data is bad and must be dropped, not retried. A server can also accept part of a batch and report how many items it rejected. The specification recommends a 64 MiB request size limit, and it accepts that a retry after a network failure can produce duplicate data — a deliberate trade-off for telemetry.
You can see OTLP for yourself with nothing but curl. With a local Collector listening on port 4318, this request creates one span:
curl -X POST http://127.0.0.1:4318/v1/traces \ -H 'Content-Type: application/json' \ -d '{"resourceSpans":[{"resource":{"attributes":[ {"key":"service.name","value":{"stringValue":"checkout"}}]}, "scopeSpans":[{"scope":{"name":"manual-test"},"spans":[{ "traceId":"5b8efff798038103d269b633813fc60c", "spanId":"eee19b7ec3c1b174", "name":"POST /checkout","kind":2, "startTimeUnixNano":"1760425200000000000", "endTimeUnixNano":"1760425200250000000"}]}]}]}'# → {"partialSuccess":{}} HTTP 200Note the details the JSON encoding requires: trace and span IDs are hex strings, not base64, and kind is the integer 2 (server), not a name.
The OpenTelemetry Collector
The Collector is a single Go binary configured with YAML. It is the part of OpenTelemetry that operations teams actually run, and it is worth understanding properly.
Receivers, processors, exporters and connectors
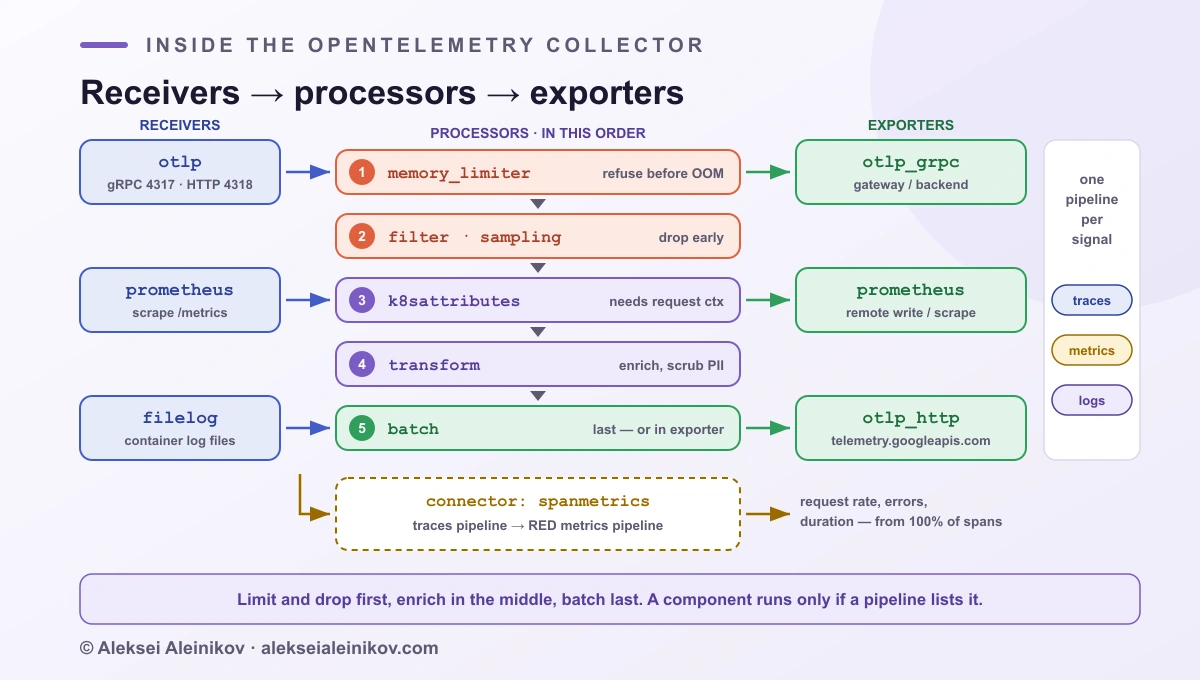
A configuration has four kinds of pipeline components:
- Receivers bring data in.
otlpis the main one; others scrape Prometheus endpoints, read Kafka topics, tail log files or collect host metrics. - Processors change data in flight: limit memory, filter, add or delete attributes, sample, batch.
- Exporters send data out — to another Collector, Prometheus, Google Cloud, Datadog, a file, or the
debugexporter that prints to the console. - Connectors join two pipelines, acting as an exporter on one side and a receiver on the other. The
spanmetricsconnector, for example, turns spans into request-rate, error and duration metrics.
Defining a component does nothing on its own. It only runs when you list it in a pipeline under service.pipelines, separately for traces, metrics and logs.
Processor order is not cosmetic
Processors run in the order you list them, and the project documents a recommended order:
memory_limiterfirst, so the Collector can refuse data before it runs out of memory.- Sampling and filtering next, so you do not spend CPU on data you are about to drop.
- Processors that need the request context, such as
k8sattributes, before batching — batching clears that context. - Enrichment and transformation:
attributes,transform,resource. - Batching last, ideally in the exporter itself through its sending queue rather than a separate
batchprocessor.
Here is a complete agent configuration, as it would run on every Kubernetes node:
receivers:  otlp:    protocols:      grpc:        endpoint: 0.0.0.0:4317      http:        endpoint: 0.0.0.0:4318
processors:  memory_limiter:    check_interval: 1s    limit_percentage: 80    spike_limit_percentage: 20  k8sattributes:    extract:      metadata: [k8s.namespace.name, k8s.deployment.name, k8s.pod.name, k8s.node.name]  resourcedetection:    detectors: [env, gcp]    timeout: 5s  attributes/scrub:    actions:      - key: http.request.header.authorization        action: delete      - key: user.email        action: hash
exporters:  otlp_grpc/gateway:    endpoint: otel-gateway.observability.svc.cluster.local:4317    sending_queue:      batch:
extensions:  health_check:    endpoint: 0.0.0.0:13133
service: extensions: [health_check] pipelines: traces: receivers: [otlp] processors: [memory_limiter, k8sattributes, resourcedetection, attributes/scrub] exporters: [otlp_grpc/gateway] metrics: receivers: [otlp] processors: [memory_limiter, k8sattributes, resourcedetection] exporters: [otlp_grpc/gateway] logs: receivers: [otlp] processors: [memory_limiter, k8sattributes, resourcedetection, attributes/scrub] exporters: [otlp_grpc/gateway]Two security details hide in that file. The Collector binds to localhost by default; 0.0.0.0 is needed in a pod so other pods can reach it, and it should then be protected by a NetworkPolicy. And the attributes/scrub processor is the cheapest place in your whole stack to stop an authorization header or an email address from being stored in a third-party backend.
Which Collector distribution?
The Collector is built from components, and several distributions bundle different sets:
otelcol(core) — a small set of upstream components.otelcol-contrib— almost every community component; convenient for learning, larger than you need in production.otelcol-k8s— components selected for Kubernetes.- Vendor distributions such as the Google-Built OpenTelemetry Collector or Grafana Alloy, tested against one platform.
- Your own build with the OpenTelemetry Collector Builder (
ocb), containing exactly the components you use — the smallest attack surface.
Agent or Gateway: How to Deploy the Collector
There are two building blocks, and most production setups use both.
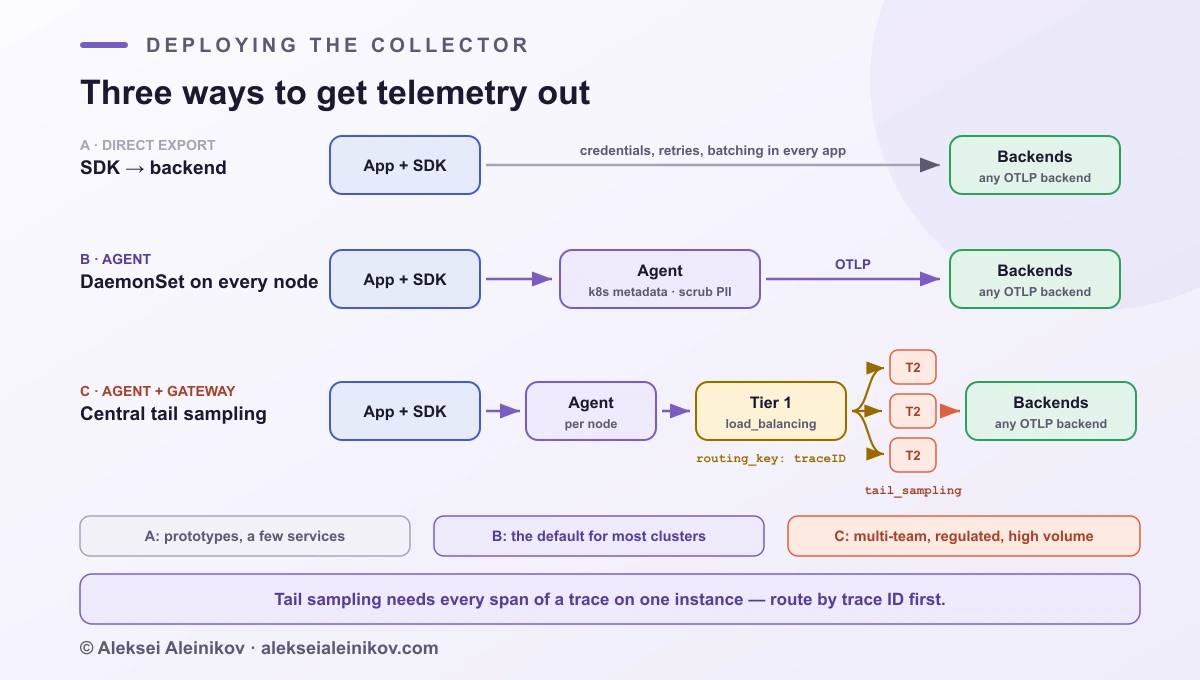
An agent runs close to the application — as a DaemonSet on every Kubernetes node or as a sidecar. Applications send to a local endpoint, which keeps their configuration trivial, and the agent adds host and pod metadata cheaply because it runs on the same node.
A gateway is a central, horizontally scaled pool of Collectors behind one OTLP endpoint — typically one per cluster or region. The official deployment guide lists its benefits as centrally managed credentials and centralised policy such as filtering and sampling, and its costs as one more thing to maintain and fail, added latency and higher resource use.
| Direct export | Agent only | Agent + gateway | |
|---|---|---|---|
| Moving parts | None | One DaemonSet | DaemonSet + Deployment |
| Backend credentials | In every app | On every node | In one place |
| Kubernetes metadata | From the SDK | Yes, cheap | Yes, added by the agent |
| Tail sampling | No | No | Yes |
| Fan-out to several backends | Per app | Per node | Central |
| Good for | Prototypes, a few services | Most clusters | Multi-team platforms, regulated data, high volume |
Tail sampling needs all the spans in one place
Tail sampling is the main reason to build a gateway, and it has a catch: a sampler can only judge a trace if it sees every span of that trace, while those spans arrive from many pods. The documented solution is two tiers. The first tier uses the load_balancing exporter with routing_key: traceID to send all spans of a trace to the same instance in the second tier, which runs the tail_sampling processor.
The second-tier configuration below keeps every error, every trace slower than two seconds and 10% of the rest — and computes request-rate, error and duration metrics from all spans before sampling, so dashboards stay accurate even though only part of the traces are stored:
receivers:  otlp:    protocols:      grpc:        endpoint: 0.0.0.0:4317
connectors:  spanmetrics:          # RED metrics from 100% of spans, before sampling  forward/sample:       # hands the same spans to the sampling pipeline
processors:  memory_limiter:    check_interval: 1s    limit_percentage: 80    spike_limit_percentage: 20  tail_sampling:    decision_wait: 10s    num_traces: 100000    policies:      - name: keep-errors        type: status_code        status_code: { status_codes: [ERROR] }      - name: keep-slow        type: latency        latency: { threshold_ms: 2000 }      - name: sample-the-rest        type: probabilistic        probabilistic: { sampling_percentage: 10 }  resource/gcp:    attributes:      - key: gcp.project_id        value: ${env:GOOGLE_CLOUD_PROJECT}        action: insert
exporters:  otlp_http/gcp:    endpoint: https://telemetry.googleapis.com    encoding: proto    auth: { authenticator: googleclientauth }    sending_queue:      batch:
extensions:  googleclientauth:
service:  extensions: [googleclientauth]  pipelines:    traces/in:      receivers: [otlp]      processors: [memory_limiter]      exporters: [spanmetrics, forward/sample]    traces/sampled:      receivers: [forward/sample]      processors: [tail_sampling, resource/gcp]      exporters: [otlp_http/gcp]    metrics/red:      receivers: [spanmetrics]      processors: [resource/gcp]      exporters: [otlp_http/gcp]
The policies are evaluated together: a trace is kept if any of them says yes. decision_wait is how long the gateway buffers a trace before deciding, and num_traces bounds how many it holds in memory — size both against your traffic, because this tier is stateful.
One rule for metrics: a single writer
When several Collectors export the same metric stream, they can overwrite each other and produce gaps, jumps and “out-of-order sample” errors in Prometheus. The OpenTelemetry data model requires every metric stream to have a single writer. In practice that means each stream must carry attributes that uniquely identify where it came from — k8sattributes and resourcedetection provide them — and that you should not let two Collectors scrape the same target.
Instrumenting Your Code
There are two ways to make an application emit telemetry, and you will use both.
Zero-code instrumentation
Zero-code (also called automatic) instrumentation hooks into popular frameworks and clients at runtime — web servers, HTTP clients, database drivers, message queues — and creates spans and metrics for them without touching your source.
pip install opentelemetry-distro opentelemetry-exporter-otlpopentelemetry-bootstrap -a install # adds instrumentation for installed librariesOTEL_SERVICE_NAME=checkout \OTEL_EXPORTER_OTLP_ENDPOINT=http://127.0.0.1:4317 \opentelemetry-instrument python app.pynpm install --save @opentelemetry/api @opentelemetry/auto-instrumentations-nodeexport OTEL_SERVICE_NAME=checkoutexport OTEL_EXPORTER_OTLP_ENDPOINT=http://127.0.0.1:4317export NODE_OPTIONS="--require @opentelemetry/auto-instrumentations-node/register"node app.jsFor Java, the equivalent is the OpenTelemetry Java agent, attached with -javaagent:opentelemetry-javaagent.jar. Python works by monkey-patching libraries at runtime; the Java agent by rewriting bytecode as classes load.
Manual spans where the business logic lives
Automatic instrumentation sees HTTP and SQL. It cannot see that a request was a refund, which tenant it belonged to, or that the payment provider timed out on the third retry. Add those with a few lines of the API:
from opentelemetry import tracefrom opentelemetry.sdk.resources import Resourcefrom opentelemetry.sdk.trace import TracerProviderfrom opentelemetry.sdk.trace.export import BatchSpanProcessorfrom opentelemetry.exporter.otlp.proto.http.trace_exporter import OTLPSpanExporter
provider = TracerProvider(resource=Resource.create({"service.name": "checkout"}))provider.add_span_processor(BatchSpanProcessor(OTLPSpanExporter()))trace.set_tracer_provider(provider)tracer = trace.get_tracer("checkout.payments")

def charge(order_id: str, amount_cents: int) -> None:    with tracer.start_as_current_span("charge card") as span:        span.set_attribute("order.id", order_id)        span.set_attribute("payment.amount_cents", amount_cents)        try:            call_payment_provider(order_id, amount_cents)        except TimeoutError as exc:            span.record_exception(exc)            span.set_status(trace.Status(trace.StatusCode.ERROR, "provider timeout"))            raise
When the provider times out, the Collector receives a span named charge card with status Error, the message provider timeout, both attributes and an exception event carrying the stack trace. If you use zero-code instrumentation as well, skip the provider setup lines — the agent configures the SDK for you, and your code only needs trace.get_tracer.
Follow the semantic conventions for anything that already has a standard name (http.request.method, db.system.name, messaging.system), and use your own namespace, such as payment.amount_cents, for the rest.
Language maturity
Traces are stable in almost every language, metrics in the most widely used ones, and logs only in some. The official status table:
| Language | Traces | Metrics | Logs |
|---|---|---|---|
| Java, .NET, C++, PHP | Stable | Stable | Stable |
| Go | Stable | Stable | Release candidate |
| Python, JavaScript | Stable | Stable | Development |
| Rust | Beta | Stable | Stable |
| Ruby, Swift, Erlang/Elixir | Stable | Development | Development |
| Kotlin | Development | Development | Development |
Development does not mean unusable — many teams ship Python logs through OpenTelemetry — but it does mean APIs can still change between releases. Pin versions.
Running OpenTelemetry on Kubernetes
The OpenTelemetry Operator manages two things in a cluster: Collectors, through an OpenTelemetryCollector resource that can run as a Deployment, DaemonSet, StatefulSet or sidecar, and auto-instrumentation, through an Instrumentation resource. It usually needs cert-manager for its admission webhook.
The Instrumentation resource describes where to send data and how to sample:
apiVersion: opentelemetry.io/v1alpha1kind: Instrumentationmetadata: name: default namespace: shopspec: exporter: endpoint: http://otel-agent.observability.svc.cluster.local:4318 propagators: [tracecontext, baggage] sampler: type: parentbased_traceidratio argument: "0.25"Applications opt in with one annotation on the pod template:
spec: template: metadata: annotations: instrumentation.opentelemetry.io/inject-python: "true"If the agent runs as a DaemonSet, give its Service internalTrafficPolicy: Local, so each pod sends to the agent on its own node instead of a random one across the cluster.
When the pod starts, the Operator adds an init container that copies the instrumentation into the pod and sets the environment variables. Three details cause most failed rollouts:
- Order matters. The
Instrumentationresource must exist before the pods start; pods created earlier are not instrumented until they restart. - The annotation belongs in
spec.template.metadata.annotations, not in the Deployment’s own metadata. - Protocols differ by language. Python injection only supports OTLP over HTTP, so its endpoint must use port 4318; Node.js defaults to gRPC on 4317. Go is instrumented through a privileged eBPF sidecar and is disabled by default behind a feature gate.
On GKE you can skip running Collectors yourself: Google offers Managed OpenTelemetry for GKE, and also publishes the Google-Built OpenTelemetry Collector with a vetted configuration if you prefer to run your own. The rest of the cluster design — Workload Identity, NetworkPolicies, where the gateway lives — fits into the same structure as the secure-by-default GKE reference architecture.
Where the Data Goes: Choosing a Backend
OpenTelemetry stops at the exporter. Everything after that is a backend decision, and because every serious backend accepts OTLP now, you can change your mind later.
| Backend | Signals | How it receives OpenTelemetry | Worth knowing |
|---|---|---|---|
| Prometheus | Metrics | Native OTLP receiver at /api/v1/otlp/v1/metrics, enabled with --web.enable-otlp-receiver; or scraped through the Collector |
HTTP only; enable out-of-order ingestion (30 minutes is a good start) when several Collectors write |
| Grafana Tempo / Loki / Mimir | Traces / logs / metrics | OTLP | Loki stores most attributes as structured metadata and allows 15 index labels by default — keep k8s.pod.name out of the labels |
| Jaeger v2 | Traces | OTLP; Jaeger v2 itself is built on the Collector framework | In-memory all-in-one is for development only |
| Google Cloud Observability | All three | Telemetry (OTLP) API at telemetry.googleapis.com, gRPC or HTTP |
Requires gcp.project_id on the resource; metrics land as Prometheus time series |
| Datadog, New Relic, Dynatrace, Honeycomb | All three | OTLP endpoints or Collector exporters | You keep their analysis; you drop their proprietary agent |
On Google Cloud specifically, the Telemetry API takes all three signals through one endpoint. The writer needs the roles/telemetry.writer role plus Service Usage Consumer on the quota project, and authentication in the Collector goes through the googleclientauth extension — ideally with Workload Identity rather than a key file, for the reasons in killing service account keys with Workload Identity Federation. The default metrics quota is 60,000 requests per minute per region at up to 200 points per request — about 200,000 samples per second — and metrics ingestion through it needs Collector 0.140.0 or newer.
OpenTelemetry vs Prometheus vs Vendor Agents
This is the comparison people search for, and the honest answer is that the three are not competitors on the same layer.
| OpenTelemetry | Prometheus | Vendor agent (Datadog, Dynatrace…) | |
|---|---|---|---|
| What it is | Standard + SDKs + Collector | Metrics database, query language and alerting | Proprietary collection for one backend |
| Signals | Traces, metrics, logs (profiles coming) | Metrics | Usually all, plus vendor extras |
| Model | Mostly push over OTLP | Mostly pull (scraping) | Push to the vendor |
| Storage and UI | None — you choose | Yes | The vendor’s |
| Lock-in | None | Low | High |
| Replaces | Vendor SDKs and agents | Nothing in OpenTelemetry; it is a backend | — |
So the practical answer to “OpenTelemetry or Prometheus?” is usually both: instrument with OpenTelemetry, and store metrics in Prometheus or a managed Prometheus service. And the answer to “OpenTelemetry or Datadog?” is that OpenTelemetry replaces the Datadog agent, not Datadog: you keep the product and gain the freedom to leave it.
Sampling: Keep the Traces That Matter
At scale you cannot afford to store every trace, and you do not need to. The OpenTelemetry documentation suggests considering sampling once you generate 1,000 or more traces per second, and notes that at high volume a sample of 1% or less can represent the rest accurately.
- Head sampling decides when the root span starts. The usual choice is
parentbased_traceidratio: the root service keeps a fixed share of traces chosen by trace ID, and every downstream service follows the parent’s decision, so you never get half a trace. It is cheap and stateless, but it cannot know whether the trace will end in an error. - Tail sampling decides after the trace is complete, so it can keep every error and every slow request. It needs the stateful gateway tier described above, and it is harder to size and operate.
Many teams combine them: a generous head sample to protect the pipeline from overload, then tail sampling in the gateway to choose which traces are worth paying for. One rule makes either approach safe — compute metrics before you sample traces, as the spanmetrics connector does in the gateway config, so dashboards and SLOs are based on 100% of requests.
Production Pitfalls That Make OpenTelemetry Expensive
Almost every OpenTelemetry cost problem comes from a handful of mistakes.
Metric cardinality. Every unique combination of attribute values is a separate time series. A latency histogram with http.route and http.response.status_code is fine; add user.id or order.id and you create one series per customer. Keep identifiers on spans and logs — where they are useful — and out of metrics. Drop offending attributes in the Collector with the attributes or transform processor.
Keeping every healthy trace. A successful GET /health traced 100% of the time is pure cost. Filter health checks out entirely and sample the rest.
Personal data in attributes. Instrumentation can record URLs with query strings, headers and SQL statements. Scrub or hash anything personal in the agent, before it leaves the node — the cheapest GDPR control you will ever deploy.
Logs copied into every record. Some backends duplicate resource and scope attributes into each stored log entry, so a large resource multiplies log volume. Google Cloud’s documentation calls this out explicitly; trim resource attributes before export.
No limits on the Collector. Without memory_limiter, an incident that doubles traffic can kill the Collector exactly when you need it. Watch its own metrics — refused, dropped and queued items — and size the gateway for incident-level traffic, not an average day.
Broken context across async boundaries. Traces that stop at a queue usually mean a producer that does not inject context. For batch consumers that process many messages at once, use span links to connect one consumer span to many producer spans instead of forcing a single parent.
Telemetry is a data pipeline like any other. Budget it, rate-limit it, scrub it and monitor it — or it will quietly become the most expensive and least trusted system you run.
Production Checklist
Instrumentation:
service.name,service.versionanddeployment.environment.nameset on every service- Zero-code instrumentation enabled, manual spans around business operations
- Semantic conventions used for standard attributes; own namespace for the rest
- Context propagated through HTTP, gRPC and message queues
- SDK and instrumentation versions pinned
Collector:
- Agent as a DaemonSet; gateway only where you need central policy or tail sampling
memory_limiterfirst, batching last,k8sattributesbefore batching- PII scrubbed in the agent; credentials only in the gateway or via Workload Identity
- Configs validated in CI with
otelcol validate; your own minimal build in production - Collector self-metrics and health check monitored and alerted
Data and cost:
- No user or request IDs in metric attributes
- Health checks filtered; head and/or tail sampling configured
- Span metrics computed before sampling
- One writer per metric stream
- Backend chosen per signal; OTLP everywhere, so it can change later
The Bottom Line
OpenTelemetry is not a product you buy or a dashboard you install. It is the plumbing: a common way for every service to describe what it is doing, a common protocol to move that description, and a Collector that decides what to keep, what to scrub and where to send it.
The payoff is leverage. Instrument once, and you can switch backends, send to two at the same time during a migration, or add tail sampling across the whole company by changing one gateway config — without touching application code. Get the boring parts right — names, cardinality, sampling and a Collector that cannot fall over — and the 3 a.m. question changes from “where do we even start?” to “click the slow span.”
Observability is the data side of a platform team’s job — platform engineering on Kubernetes covers the rest of the paved road.

From the community
Discussion on Mastodon & Bluesky
Replies to this article from the open web, pulled in live. No ads, no tracking scripts.
Reply there — it shows up here automatically.